Gold Price Chart Hints at Downside Bias Amid Conflicted Trade
JOIN OUR V.I.P SIGNALS GROUP FOR ONLY $30/MONTH
BECOME V.I.P MEMBER JOIN NOW

GOLD & CRUDE OIL TALKING POINTS:
- Gold prices pinned in place by diverging US Dollar, bond yields
- Crude oil prices echo risk trends on US-China trade war worries
- EU Commission forecast update, API and EIA data due ahead
Conflicting influences from the US Dollar and benchmark Treasury bond yields pinned gold prices in place yesterday. A volatile response to signs of escalation in the US-China trade war traced out inverse whipsaw price swings that put the metal’s defining anti-fiat and non-yielding attributes in conflict.
Crude oil prices tracked stock performance. First, WTI and S&P 500 futures sank in tandem as trade war headlines hit the wires. The two then recovered in lockstep as market sentiment trends moved to normalize toward pre-panic levels.
All the same, the mood still seems to be uneasy. Shell-shocked investors are on the lookout for headline risk, troubled by confirmation of a looming tariff hike from the White House but heartened by indications that a Chinese delegation set to arrive in Washington this week will still make the trip.
How this story develops from here may prove pivotal, leaving traders reluctant to commit to a directional bias until fresh clues emerge. Price action may be muted in the interim. Updated economic forecasts from the EU Commission are likely to deliver downgrades, which might make for a risk-off lean.
The weekly release of API inventory flow data is also due. It will be weighed against expectations of a 1.2 million barrel rise to be reported in official government figures Wednesday. An updated EIA Short-Term Energy Outlook report is also on the docket.
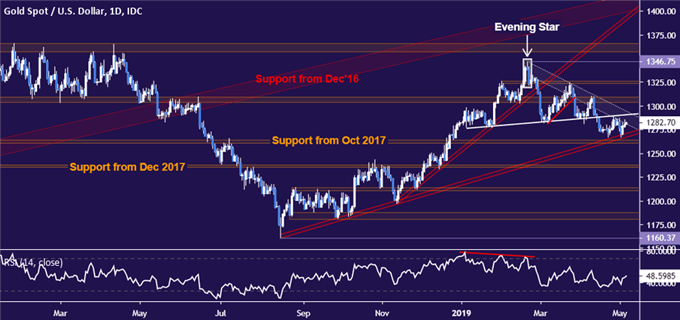
GOLD TECHNICAL ANALYSIS
Gold prices are coiling up below the $1300/oz figure, wedged between resistance capping gains since late February and support establishing the uptrend from mid-August 2018 lows. The completion of a bearish Head and Shoulders top argues in favor of a downside bias. A daily close below 1260.80 exposes the 1235.11-38.00 area. Alternatively, a break above 1294.79 eyes the 1303.70-09.12 zone next.
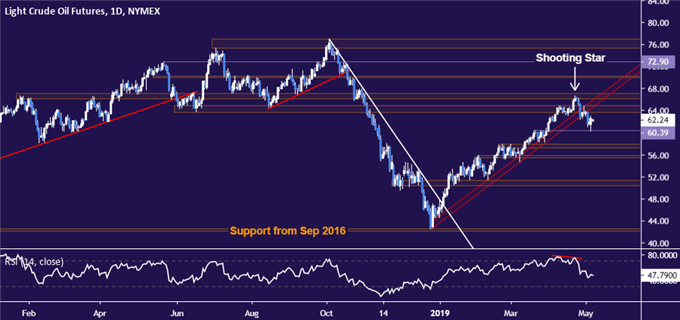
CRUDE OIL TECHNICAL ANALYSIS
Crude oil prices are testing support at 60.39, with a break confirmed on a daily closing basis setting the stage to challenge the 57.24-88 area. Forays topside face a dense layer of resistance running through 67.03. Breaching beyond that puts the $70/bbl figure into focus.
BEST XM OFFER OF FREE $30 TRADING BALANCE PROFIT WITHDRAWAL
LOW SPREAD AS 0.0 PIPS


Comments
Post a Comment